Results of some testing – moderately precise numbers for tower costs and buff effects.
I created a test map and tested several game mechanics. The map I used is screenshotted below:
Energy cost and resource production tests were done by placing 10+ of a weapon or item and checking the resulting values. Sprayers were slightly more difficult, as the consumption values are not displayed – I had to place/remove sprayers until I saw the stockpile start to decrease or increase.
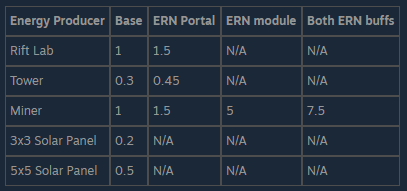
Creeper World 4 Energy Production
The Rift Lab produces 1 power on its own.
Towers with a full 121 squares of coverage produce 0.333 power per tower. However, they lose ‘efficiency’ based on the number of links between the tower and the Rift Lab. This loss appears to be logarythmic. After 12 links, a tower was at 86% efficiency.
Mines produce 1 energy.
Small (3×3) solar panels produce 0.2 energy each, while large (5×5) solar panels produce 0.5 energy.
The ERN Portal buff to energy production is a 50% boost (x1.5). It affects the Lab, Towers, and Miners. It does /not/ affect solar panels, which is probably an oversight/bug.
Attaching an ERN module directly to a miner is a 400% boost (x5). This stack multiplicatively with the Portal buff, for a total of 7.5 energy from a miner affected by both.
Results are sumarrized below:
Consumption
At constant fire rate, cannons, mortar, and nullifiers all consume 1 energy.
Sprayers at constant fire rate (or set to ‘always on’) consume 0.60 blueite. Under the effect of an ERN module, this doubles to 1.2 blueite. They behave oddly with fire rate, consuming 0.86 blueite with the the portal buff alone, and 2.0 blueite with both buffs active.
Effects
Testing equal-sized stacks of AC and creeper against one another resulted in total cancelation, as expected – neither has a ‘hidden’ advantage against the other.
A sprayer set to Always On produced a stack of 72 AC in 30 seconds. With the ERN module, this doubled to 144 AC in 30 seconds (commensurate with the increased consumption. However, when tested against an emitter set to produce 144 creeper over 30 seconds, the sprayer easily overwhelmed it. Further testing using a racing track found that a ERN-boosted sprayer was evenly matched against an emitter set to produce 21.7 every 2 seconds. This implies that the unbuffed Sprayer has an actual production rate of roughly 5.4 per second (and thus gives us a conversion of 8.1 production/per second per unit of Blueite. This means that to match a ‘standard’ emitter with 50 every half second, you would need 12.5 blueite, feeding 19 sprayers. This explains why mortars/cannons/bombers are essential for ‘pushing’ an Anti-creeper front forwards.
Testing a cannon against a 2×2 stack of creeper with height of 250, I tested a cannon under the following situations:
- Base, with no buffs: 67 seconds.
- With an ERN module: 33 seconds.
- With the ERN Portal fire rate buff: 50 seconds.
- With both ERN buffs: 25 seconds.
From this, I concluded that the fire rate buff is +25% (x1.25), and the ERN module doubles the performance of the cannon.
Cannons, snipers, and sprayer ranges are unaffected by height. Mortars, however, get a higher range with higher /relative/ height.
Thanks for the guide. It seems like it makes a lot more sense to roll out towers before miners. I wonder if pylons increase your production in a substantial way, since it reduces links to towers.
I would love to see a guide comparing guns to mortars and also aircraft. But either way, thanks for this one.